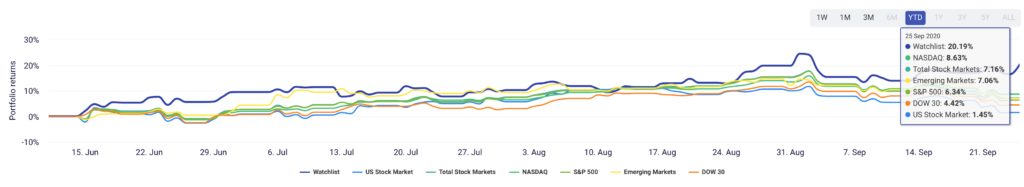
Despite the S&P 500 falling around 0.3% as we close out the end of this week, Work Tech pulled ever higher into the green, with The Starr Conspiracy’s Work Tech Index closing the week up 2.5%.
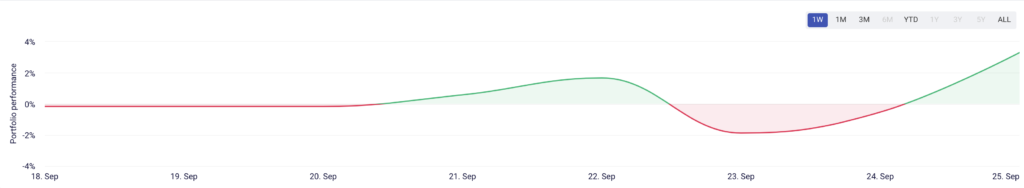
That brings our overall return to over 20% on the year, compared to the S&P 500’s 6.34%.
The big stories from this week included the passing of Ruth Bader Ginsburg, coronavirus cases increasing, all that TikTok drama, and whether capitalism is still good for society.
One question that’s been making the rounds is this:
Are we in a bubble?
On one side, you could argue the value of Work Tech has dramatically increased this year with employees at home, businesses shifting to digital operations, and how people-first companies have, well, put people first during the tribulations of 2020.
On the other side, you could argue that the market is disconnected from reality. P/E ratios are insanely high, and individual investors, as the WSJ pointed out a few weeks ago, ride the tech craze amid a so-called “Robinhood effect.” Or, as Institutional Investor called it, “#FinTok.” White-collar workers are bored at home, so they play games—one of which happens to be Robinhood.
Tech stocks’ rise is at times an anomaly to what the broader economy has experienced this year. To be sure, the stock market is not the economy, though the young-thang economist Nathan Tankus argues that it’s more closely connected than you think.
One way to analyze whether Work Tech has entered the bubble state is comparing a stock’s Relative Strength Index (RSI) to its revenue. The RSI measures momentum in a stock price. The higher the number, the more times that stock has closed in the green. Many analysts believe that an RSI of over 70 indicates an overbought stock, while under 30 represents an oversold stock. Keep this in mind when viewing the chart below.
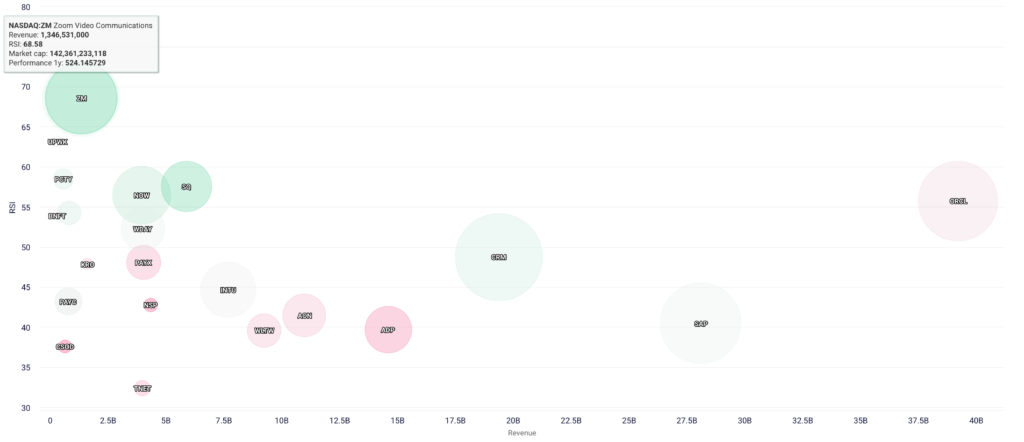
Zoom is closest to the bubble indicator, with low revenues relative to the rest of the companies but a high RSI, with Upwork, Paylocity, ServiceNow, and Square edging closer.
However, when sorting Work Tech companies by Q/Q revenue, you’ll see these same companies in the top left of the chart.

This may indicate that these companies are in fact being valued correctly, despite their high P/E ratios and high RSI measures. In other words: