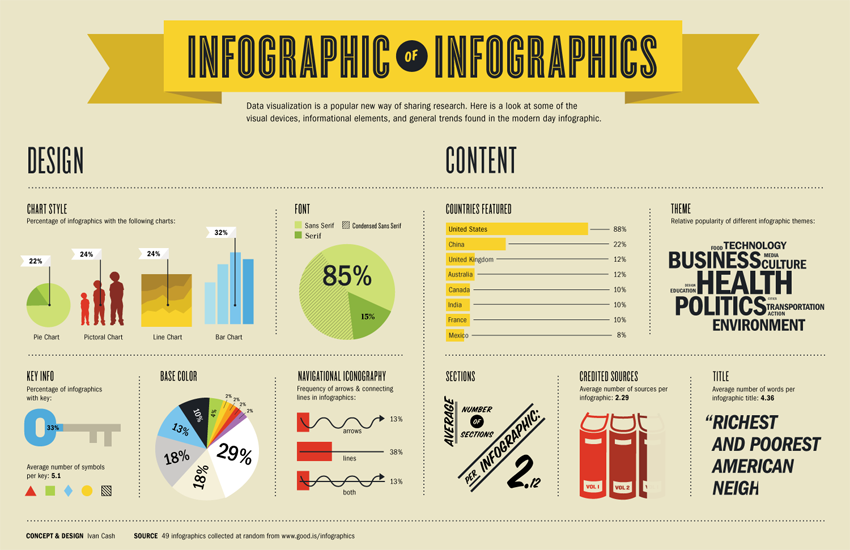
Infographics are a useful tool to communicate and streamline otherwise complicated data. They can give you visuals to understand percentages, ratios and numbers in a way few other methods of communication can. They’re a good idea, and you want to make one. But where do you begin?
Start with a Story
Any good infographic has a story to tell. Numbers are meaningless unless they have context and can help you illustrate a point. Did Minnesota have the snowiest winter on record? How many hamburgers do Americans eat? Do you think Steven Spielberg movies are the best and want to prove it? Themes and stories make much more convincing (not to mention fun) infographics.
Get Your Data Together
As we said on Tuesday, most people only retain 20 percent of what they read. So whatever information you use, be sure it’s enough to tell your story but not so much that it’s redundant or overwhelming. We typically like to keep it short whenever possible, because the less information your viewer has to take in, the better they will remember what you do say.
Leave ‘Em Wanting More
Every infographic should have one mission: to get the reader to want to know more. Give your audience an interesting introduction so they are intrigued enough to dive deeper into the subject.
In our space, infographics make wonderful companion pieces to white papers because they introduce an in-depth subject in an entertaining and engaging way. But the infographic should not tell you everything you could know from reading the white paper; it should only tell you enough to pique your interest. Effective infographics should entice to reader to delve into the white paper because they will want to know more.
Infographics are fun to look at and fun to create. If you want to know more, contact us. We’re the experts.


